ClickHouseJames Cunningham10 min readintermediate
Introducing ClickHouse's new TimeSeries Engine: Your drop-In Prometheus replacement
Summary
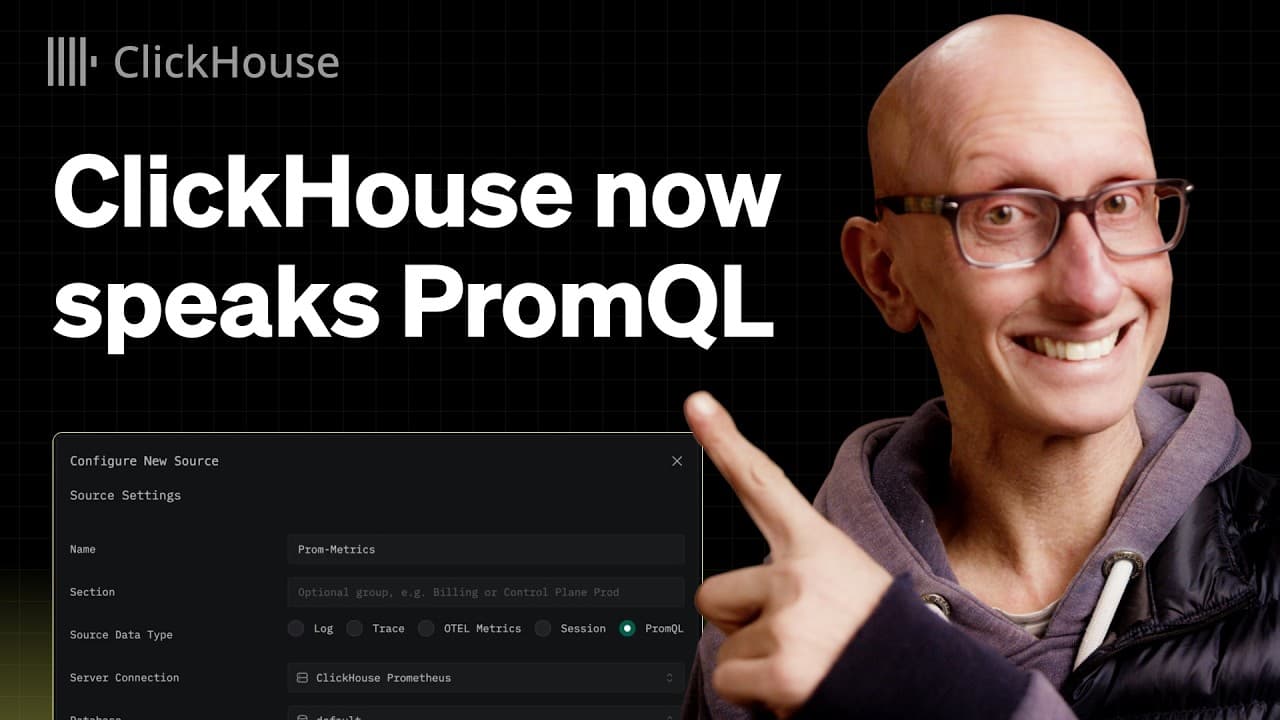
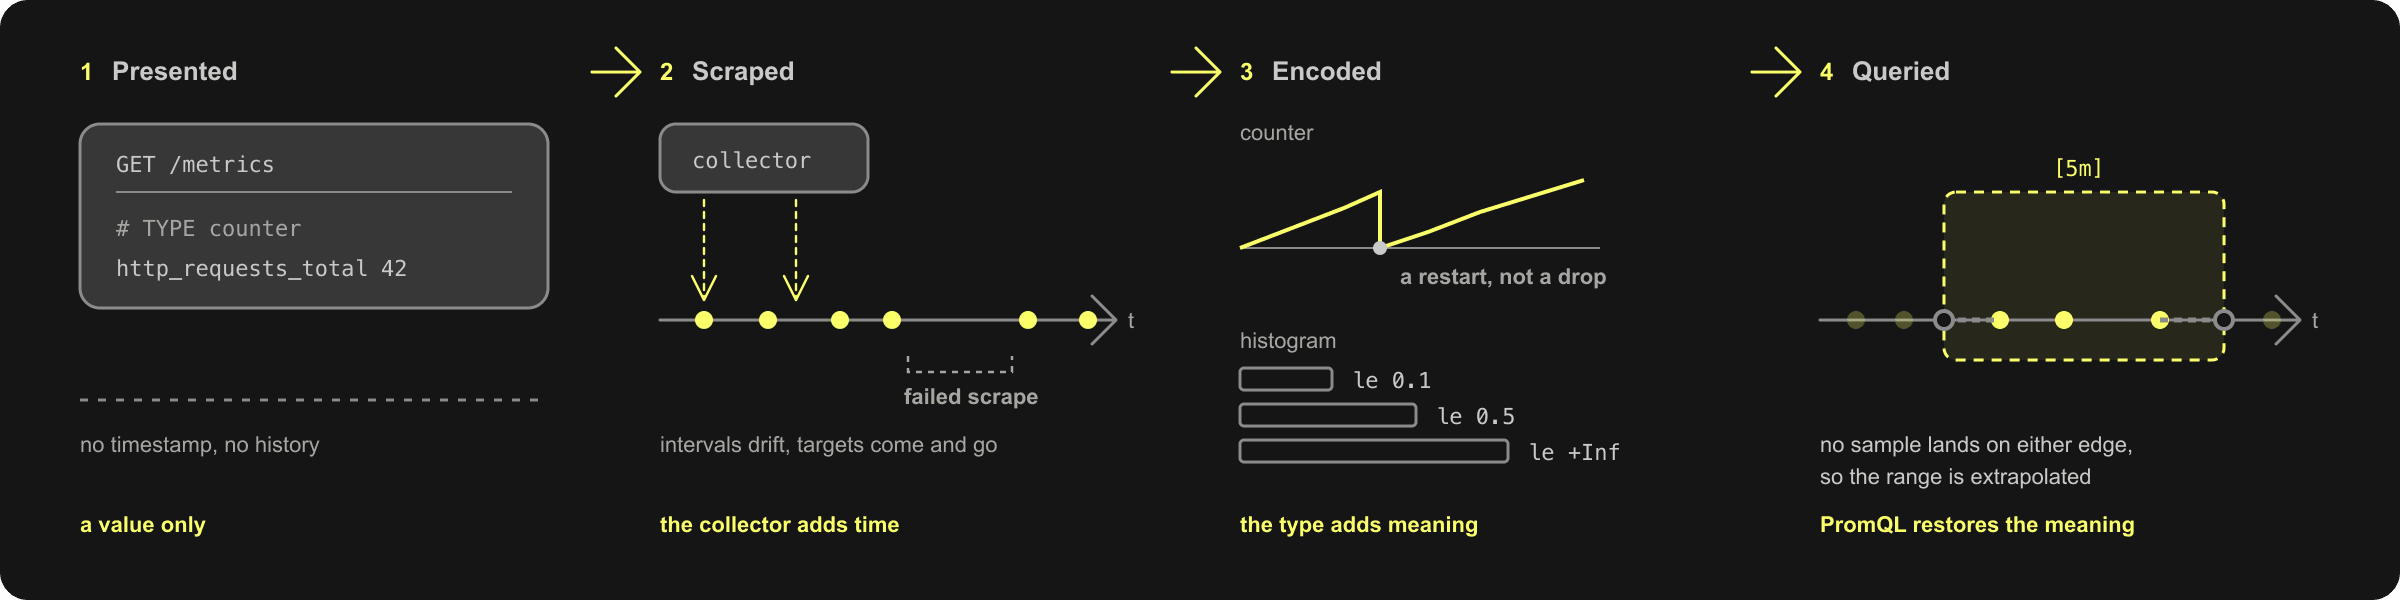
ClickHouse Cloud adds a private‑preview TimeSeries engine that ingests Prometheus remote‑write data and serves it via native PromQL, letting you keep existing PromQL queries while storing metrics in ClickHouse.
- Create a `TimeSeries` table (e.g. `CREATE TABLE prometheus.metrics ENGINE = TimeSeries;`).
- Point Prometheus remote_write or OpenTelemetry remote‑write exporter at the ClickHouse endpoint (`/prometheus/api/v1/write`).
- Query the data with any PromQL client (Grafana, curl, clickhouse‑client) – the server evaluates PromQL internally, exposing the same HTTP API as a Prometheus server.
- SQL access is also provided via `prometheusQuery` and `prometheusQueryRange` table functions.
Teams can consolidate logs, traces, and metrics in a single ClickHouse cluster without rewriting dashboards or alerts, preserving exact PromQL semantics while gaining ClickHouse’s column‑store performance.
5/10