proomt

Search

Search posts, papers, and topics

All posts

ClickHouseThe ClickStack Team16 min readintermediate
What's new in ClickStack - Aug ’26

Summary

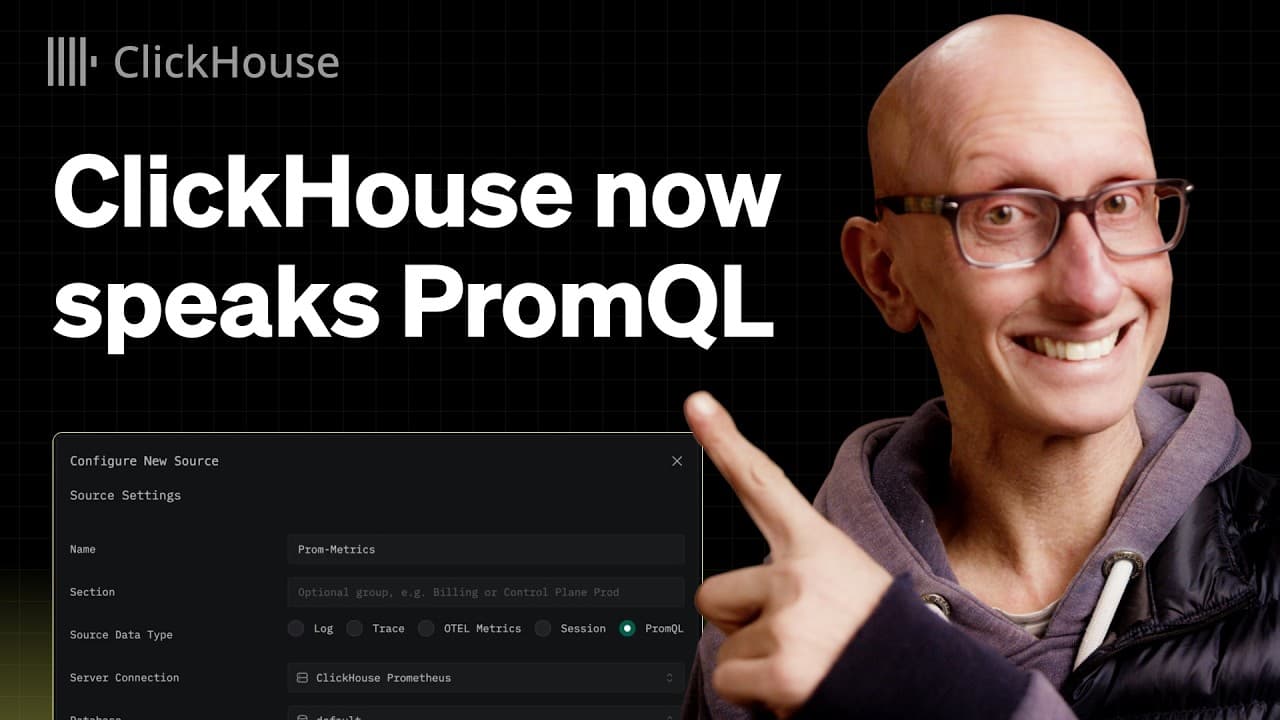
ClickStack August 2026 update adds general‑availability dashboard variables (including cross‑source SQL, Lucene, PromQL macros), chart formulas for derived metrics, a metrics explorer UI, release‑marker overlays, OIDC auth for the collector, and a beta LLM observability dashboard. It also introduces a private‑preview TimeSeries engine with PromQL support, letting ClickStack store and query Promet…

  • Dashboard variables can be referenced anywhere in a tile query via `$var` or macros like `${var:csv}` and `$__filter($var)`, enabling chained filters and cross‑source filtering (SQL ↔ PromQL).
  • Chart formulas let you compute derived series (e.g., failure rate) directly in the chart editor; formulas are evaluated server‑side and can be used in alerts.
  • Metrics explorer provides a tree‑view, search, and auto‑aggregation (avg, sum, p95) for metric selection, improving discoverability for TimeSeries‑engine metrics.
  • Release markers overlay service version deployment times on charts, using OpenTelemetry `service.version` or a custom expression.

These features tighten the feedback loop between developers and production telemetry: variables and formulas make dashboards interactive without manual query edits, release markers correlate code changes with performance anomalies, and native PromQL support lets teams migrate to ClickStack without…

5/10

Related reading

  1. September 2026 newsletter

    ClickHouse's September 2026 newsletter highlights the 26.8 release with features like pipelined SQL and custom HTTP handlers, alongside previews for On-Demand Compute and a PromQL-compatible TimeSeries engine. It also covers new Postgres integration tools and a cost-performance benchmark for cloud data warehouses.

    ClickHouseclickhouse.com7 min
  2. ClickHouse is now available on the dbt platform

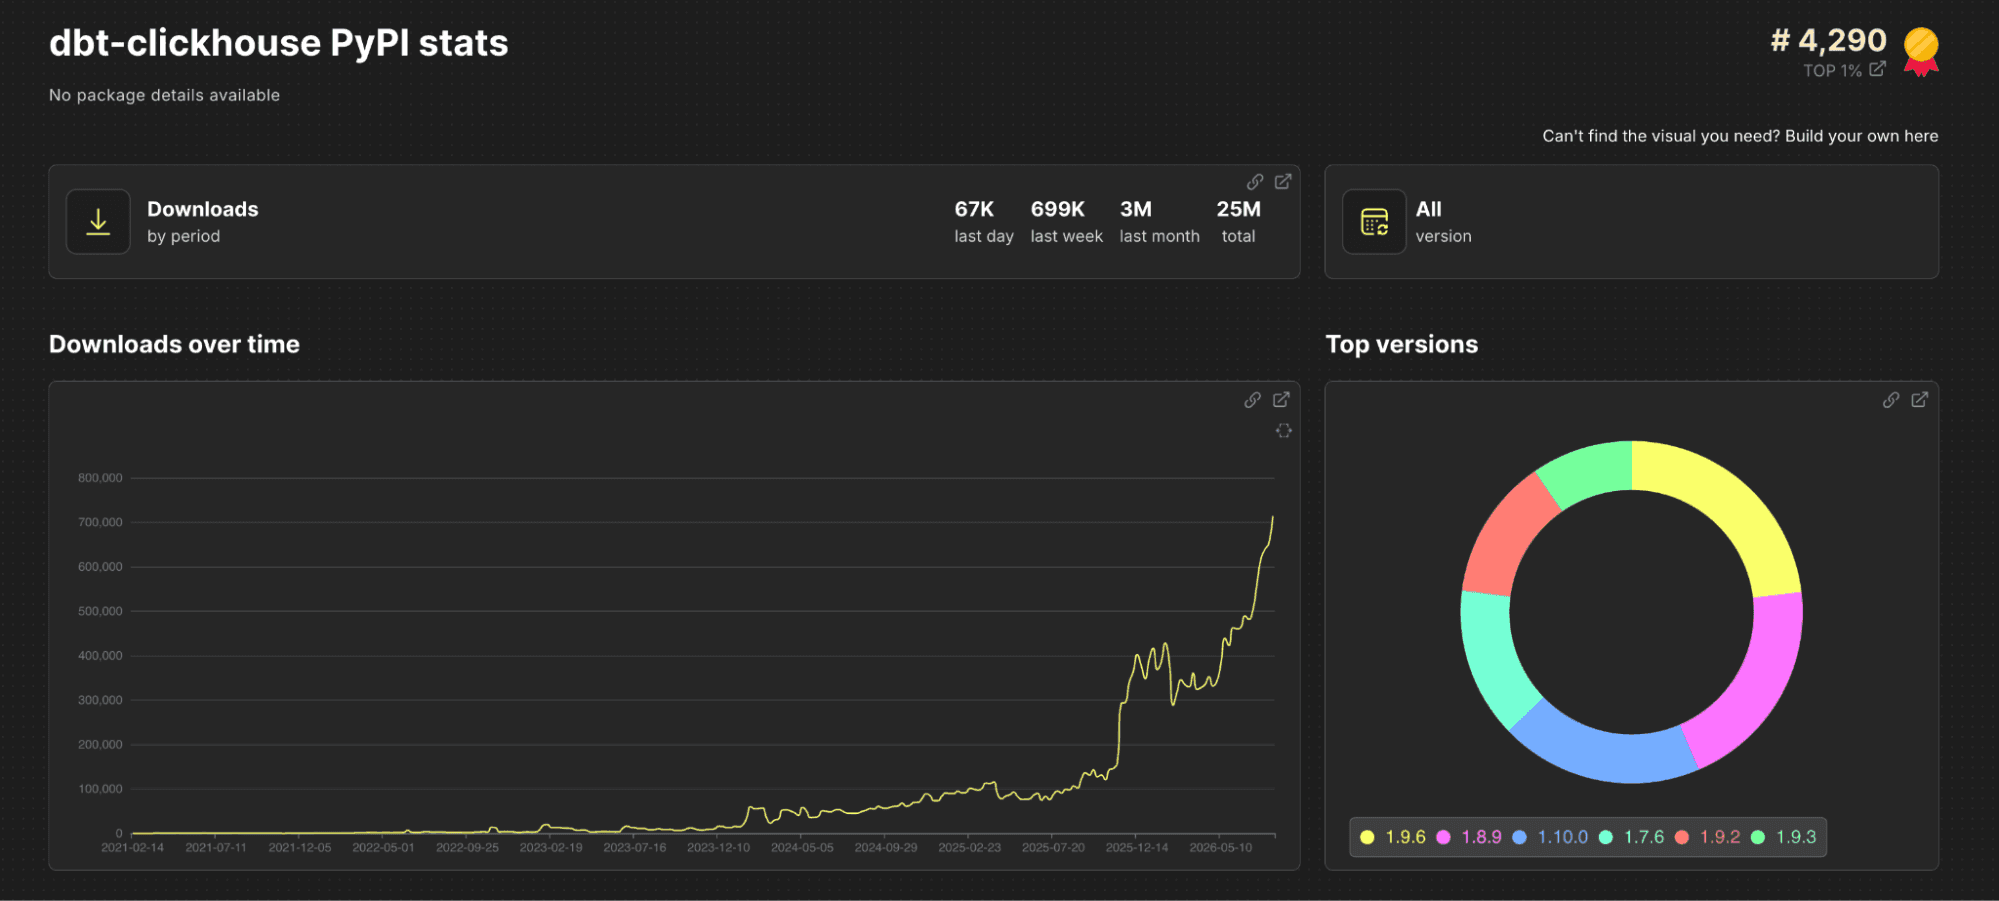
    ClickHouse released a public‑beta dbt v2 adapter written in Rust that ships inside the dbt binary and talks to ClickHouse via the new ADBC driver. The adapter promises up to 30× faster dbt parsing and leverages ClickHouse’s sub‑second, high‑concurrency engine (e.g., materialized views, MCP server). A private‑beta integration on the dbt Platform now lets users develop, schedule, and catalog ClickH…

    ClickHouseclickhouse.com8 min
  3. Postgres week in the Netherlands: PGDay Lowlands & Percona Live 2026

    The author recaps two Dutch conferences where they presented ClickHouse‑Postgres extensions and discussed PostgreSQL 19 monitoring enhancements. The post explains how pg_clickhouse provides transparent query push‑down to ClickHouse and how pg_stat_ch streams per‑query metrics, plus new logging defaults and system views in PG 19.

    ClickHouseclickhouse.com7 min
  4. How Meshtastic Metrics Exporter Turned Eight Prometheus Queries Into One with Tiger Data

    A Python exporter reads Meshtastic mesh telemetry from MQTT and writes it directly into a TimescaleDB‑enabled PostgreSQL instance, replacing a Prometheus setup that hit ~0.5 M series for 10 k nodes. The single database lets Grafana dashboards join node metadata with eight time‑series tables in one query, eliminates scrape‑budget limits, and uses native retention/compression (14‑day compression, 3…

    Timescaletigerdata.com6 min
  5. The official ClickHouse provider for Apache Airflow is now available

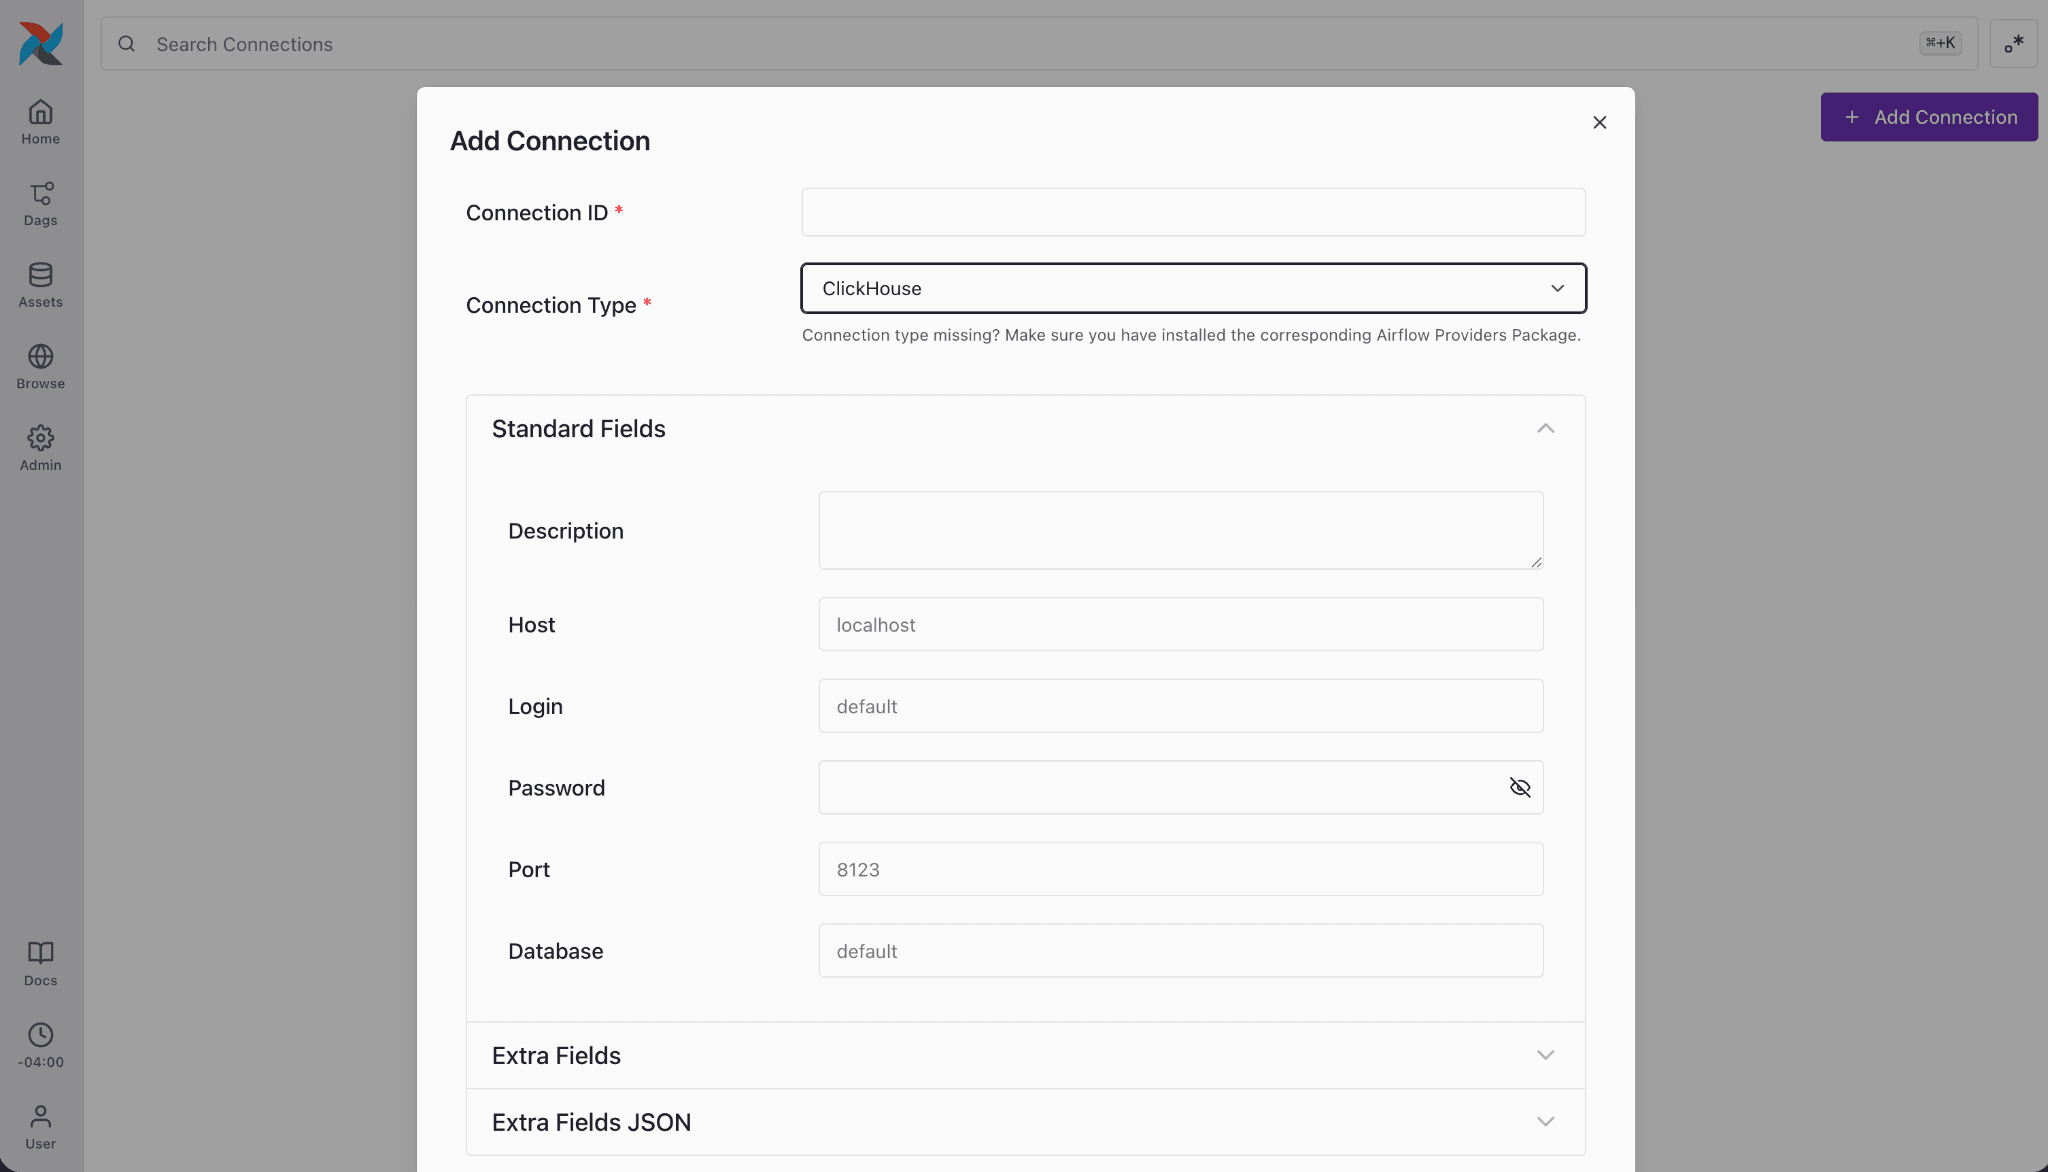
    The post announces the official ClickHouse provider for Apache Airflow, showing how to install it, configure a ClickHouse connection, and run queries using standard SQL operators or a ClickHouseHook. It includes examples for both self‑hosted Airflow and the Astronomer managed platform.

    ClickHouseclickhouse.com5 min