proomt

Search

Search posts, papers, and topics

monitoring

RSS
  1. 2

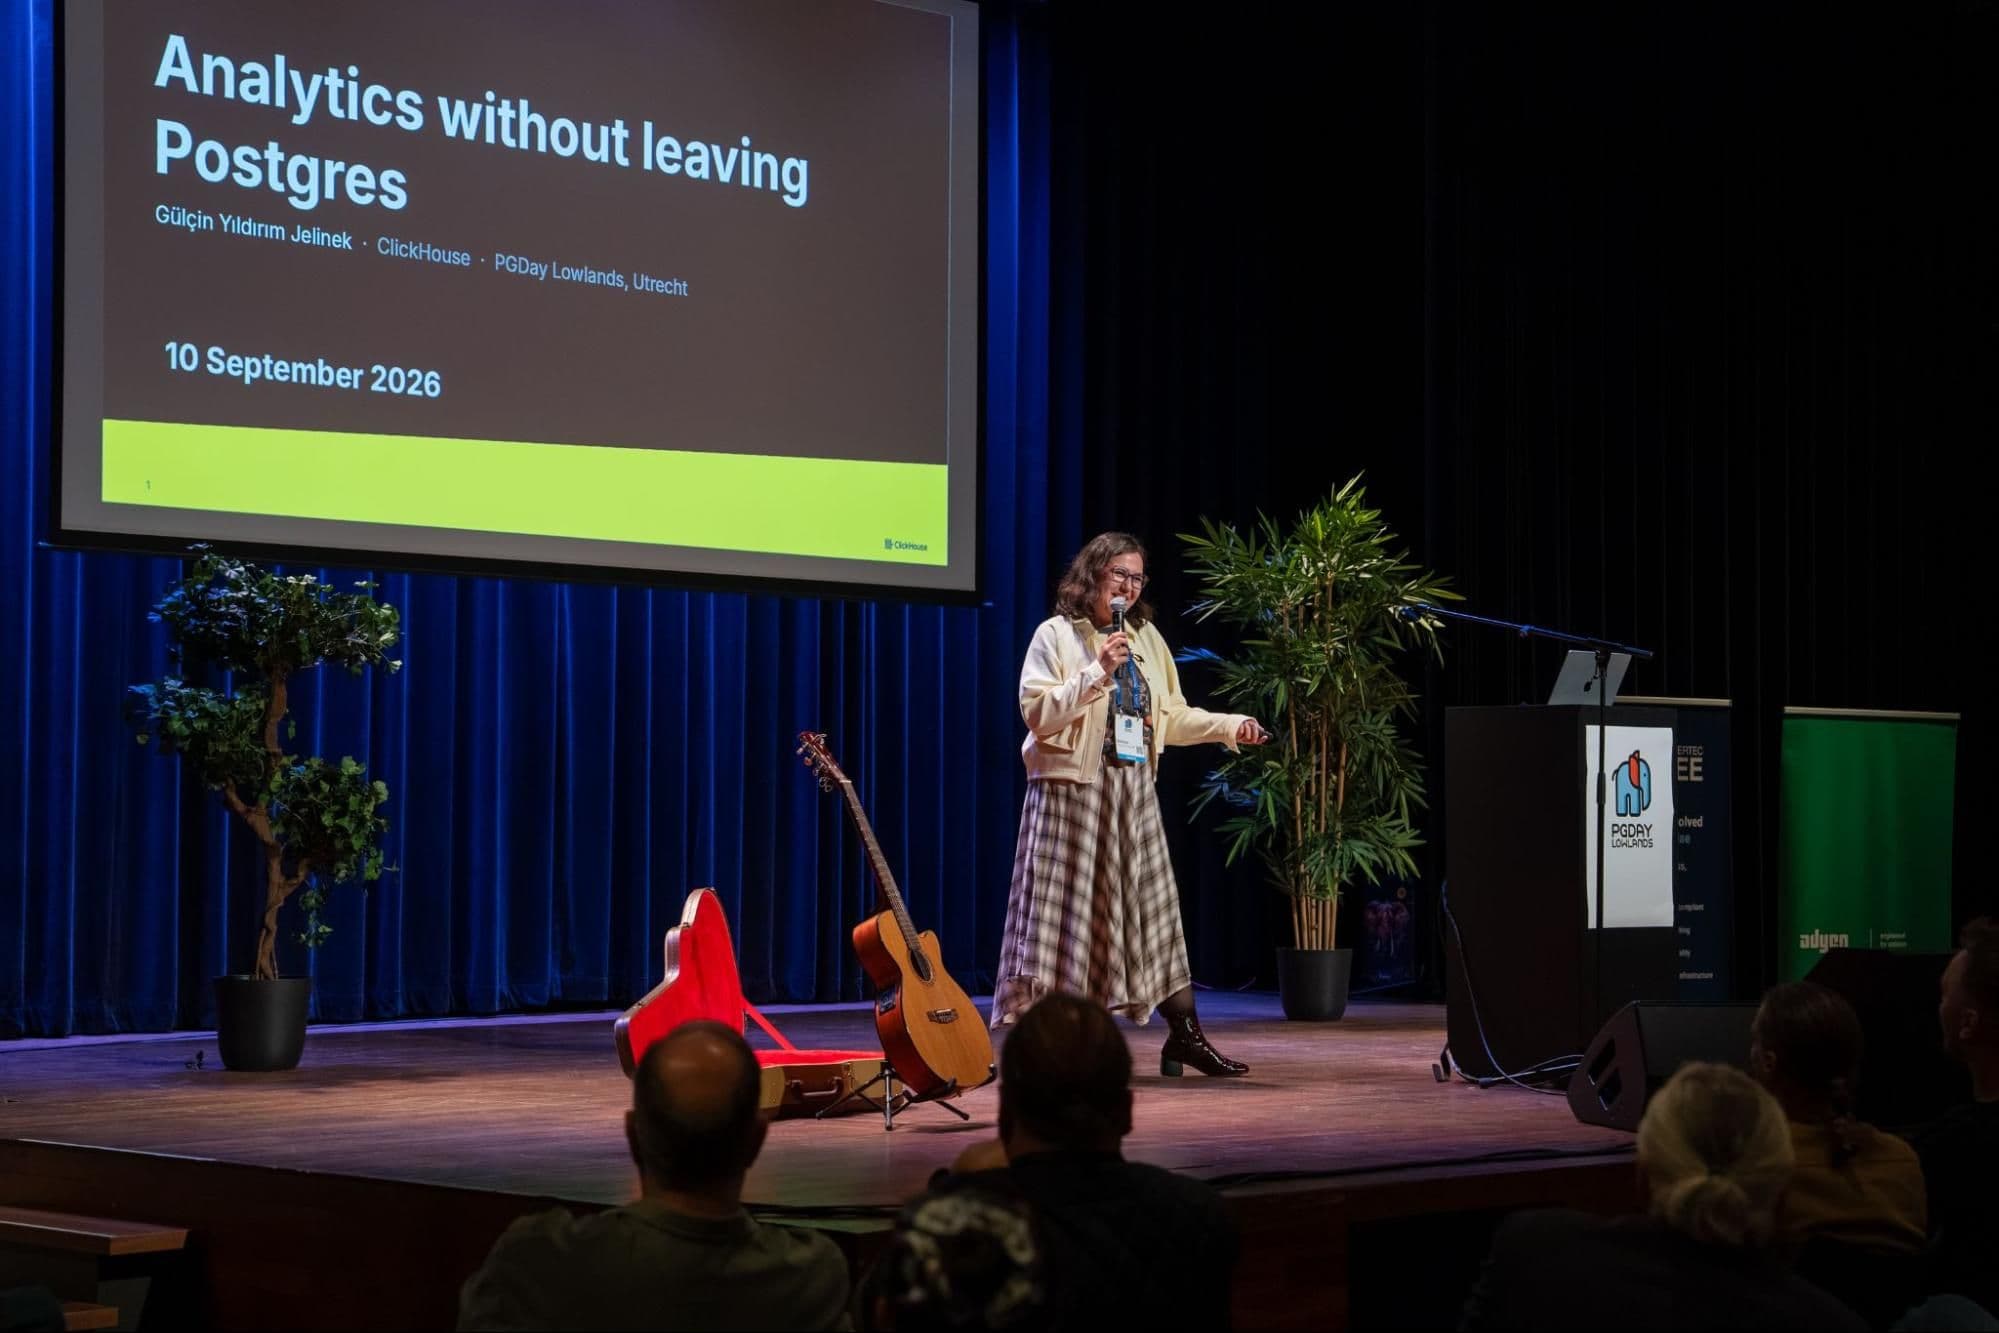
    Postgres week in the Netherlands: PGDay Lowlands & Percona Live 2026

    The author recaps two Dutch conferences where they presented ClickHouse‑Postgres extensions and discussed PostgreSQL 19 monitoring enhancements. The post explains how pg_clickhouse provides transparent query push‑down to ClickHouse and how pg_stat_ch streams per‑query metrics, plus new logging defaults and system views in PG 19.

    ClickHouseclickhouse.com7 min
  2. 3

    How Meshtastic Metrics Exporter Turned Eight Prometheus Queries Into One with Tiger Data

    A Python exporter reads Meshtastic mesh telemetry from MQTT and writes it directly into a TimescaleDB‑enabled PostgreSQL instance, replacing a Prometheus setup that hit ~0.5 M series for 10 k nodes. The single database lets Grafana dashboards join node metadata with eight time‑series tables in one query, eliminates scrape‑budget limits, and uses native retention/compression (14‑day compression, 3…

    Timescaletigerdata.com6 min
  3. 4

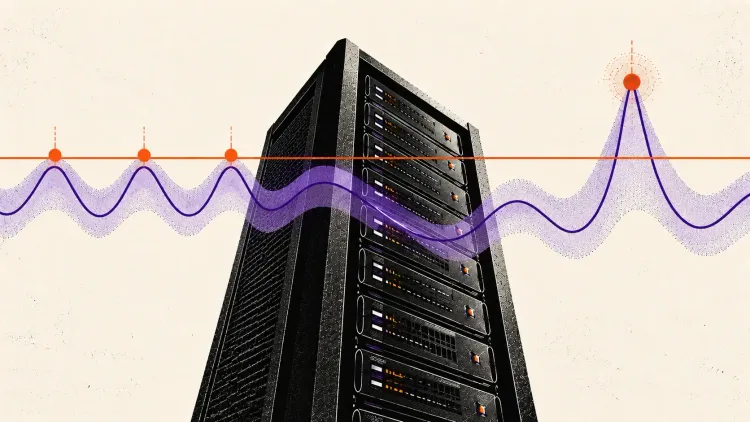
    Server Monitoring in the age of AI: What static thresholds miss and how adaptive monitoring fixes it?

    Static CPU/memory thresholds generate noise because workloads vary by time‑of‑day, day‑of‑week, and long‑term trends. Adaptive monitoring learns per‑server baselines (using simple ML on historic metrics) and creates dynamic thresholds plus anomaly alerts. ManageEngine OpManager’s Zia engine is presented as a turnkey AIOps solution that auto‑learns baselines, lets you set sensitivity, and adds ale…

    SitePointsitepoint.com6 min
  4. 5

    Health Check-up for Your Jenkins

    Kohsuke Kawaguchi outlines a few low‑effort ways to keep a Jenkins instance healthy: use jconsole to watch old‑gen heap usage, the Monitoring plugin (or Nagios) to record HTTP latency and queue length, inspect thread dumps for slow pages, and review the built‑in load chart to spot agent under‑/over‑utilisation.

    Codeshipcloudbees.com3 min