proomt

Search

Search posts, papers, and topics

All posts

MapTiler4 min readtutorialintermediate
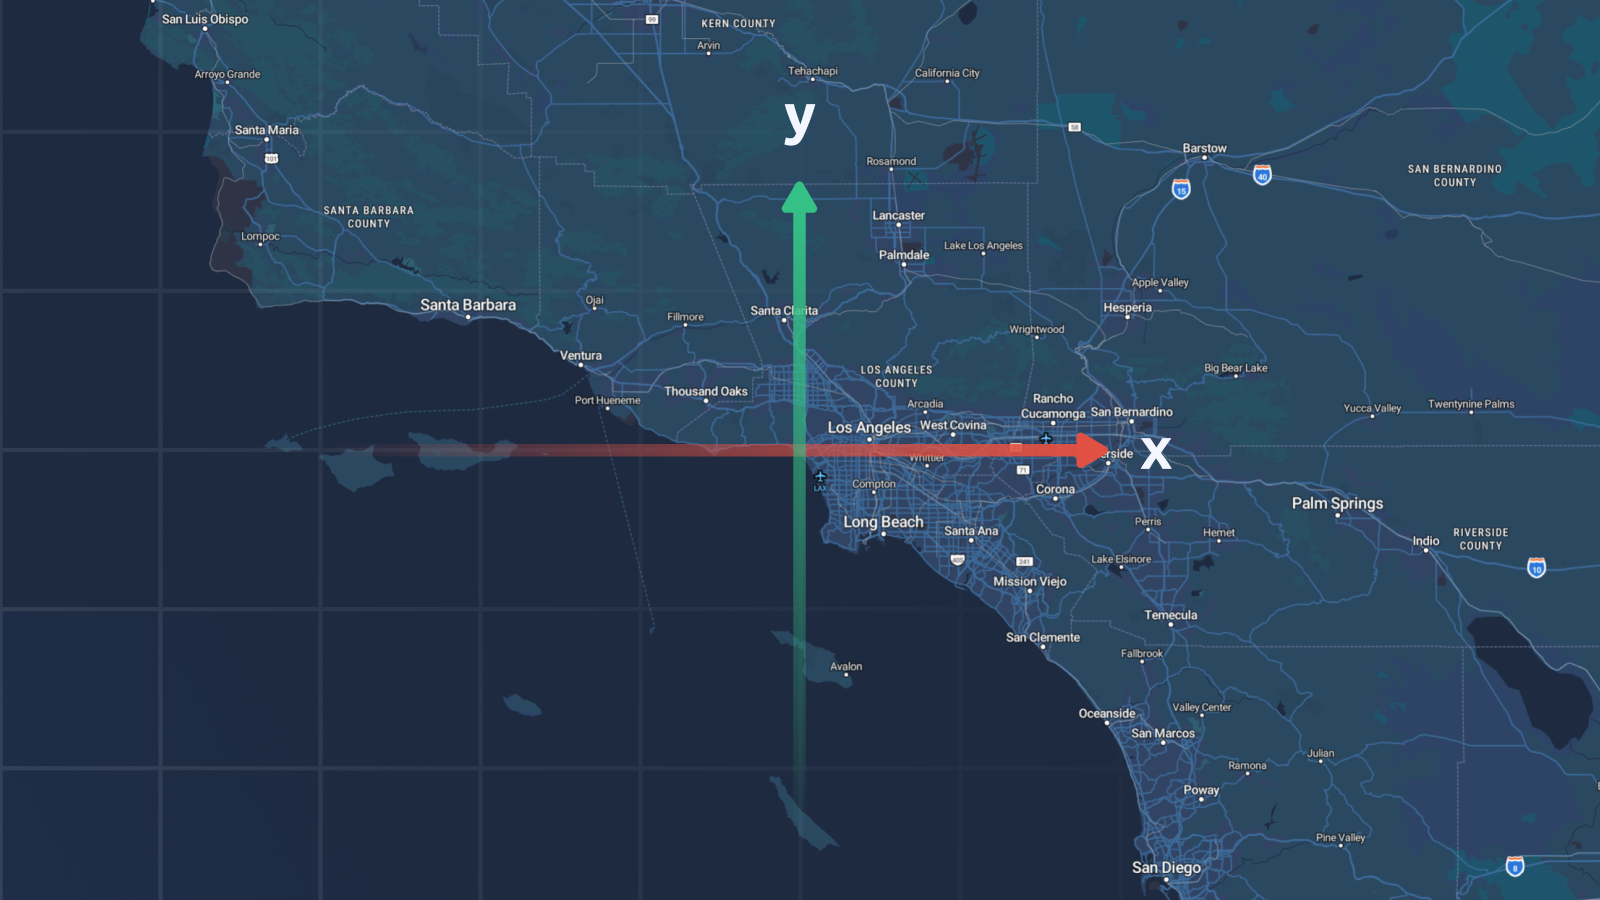
Understanding X & Y Coordinates in GIS & Web Mapping

Summary

A high‑level overview of planar (X/Y) coordinates versus geographic (lat/lon), covering projections, common pitfalls (axis order, datum shifts, unit mismatches), and typical professional use‑cases such as cadastre, CAD, drone photogrammetry, and web‑map rendering. Includes a brief mention of EPSG codes (4326 vs 3857) and MapTiler’s conversion tools.

  • X/Y are Cartesian coordinates in a projected CRS (e.g., Web Mercator EPSG:3857, UTM) measured in linear units; lat/lon are angular coordinates on an ellipsoid (EPSG:4326).
  • Common errors: swapping X/Y order, ignoring datum transformations (WGS84 vs NAD83), and mixing unit systems (meters vs feet).
  • Professional workflows (land registry, civil engineering CAD, UAV mapping) rely on accurate X/Y for distance/area calculations and require conversion to/from local projected grids.
  • MapTiler offers a bulk transformation service for CRS conversions, but the article does not provide implementation details or performance metrics.

Understanding the distinction between geographic and projected coordinate systems is essential for any engineer integrating spatial data into GIS, CAD, or web‑mapping pipelines; mistakes can introduce meter‑scale errors that break legal or engineering boundaries.

4/10
Related reading

  1. GeoSplats: Immersive 3D Content for Real Estate

    GeoSplats are MapTiler’s embeddable 3‑D models for real‑estate sites, letting users explore properties in the browser without extra software. The article outlines a three‑step upload‑locate‑embed workflow and mentions upcoming terrain blending and annotation features.

    MapTilermaptiler.com1 min
  2. The Shadows Lurking in the Equations – Underwater Islands

    The article introduces FuzzyGraph, a web tool that visualizes equations as error heatmaps (fuzzy/non‑binary mode) instead of the classic binary “exact‑equals” plots. By showing regions of high error (black‑hole shadows) and low error (underwater islands), the author argues that fuzzy graphs reveal mathematical features invisible to conventional graphing tools.

    Hacker News front pagegods.art4 minHN7013
  3. CADWorld: Computer-Use Benchmark for Long-Horizon Computer-Aided Design

    CADWorld is a new benchmark suite of 200 long‑horizon mechanical CAD tasks in FreeCAD, covering sketching, part modeling, assembly, CAM, FEM, and more. Agents interact via screenshots and GUI actions; success is checked by executable validation of the saved CAD artifacts. Seven existing agents achieve at most 17.5 % success versus an 87 % expert baseline, highlighting the gap between GUI competen…

    Hugging Face Daily Papersarxiv.org1 minpaper