proomt

Search

Search posts, papers, and topics

All posts

SitePoint18 min readintermediate

Diagnosing PostgreSQL Index Bloat, Write Amplification, and Buffer Cache Hit Ratios

Summary

This article details how to diagnose PostgreSQL index bloat, write amplification, and buffer cache inefficiency using SQL tools like pgstattuple and pg_buffercache. It provides a reusable SQL toolbox and a Docker environment to identify and understand performance bottlenecks caused by MVCC-related index fragmentation.

  • PostgreSQL MVCC causes index bloat as updates/deletes create new tuples, leaving dead entries in B-Trees.
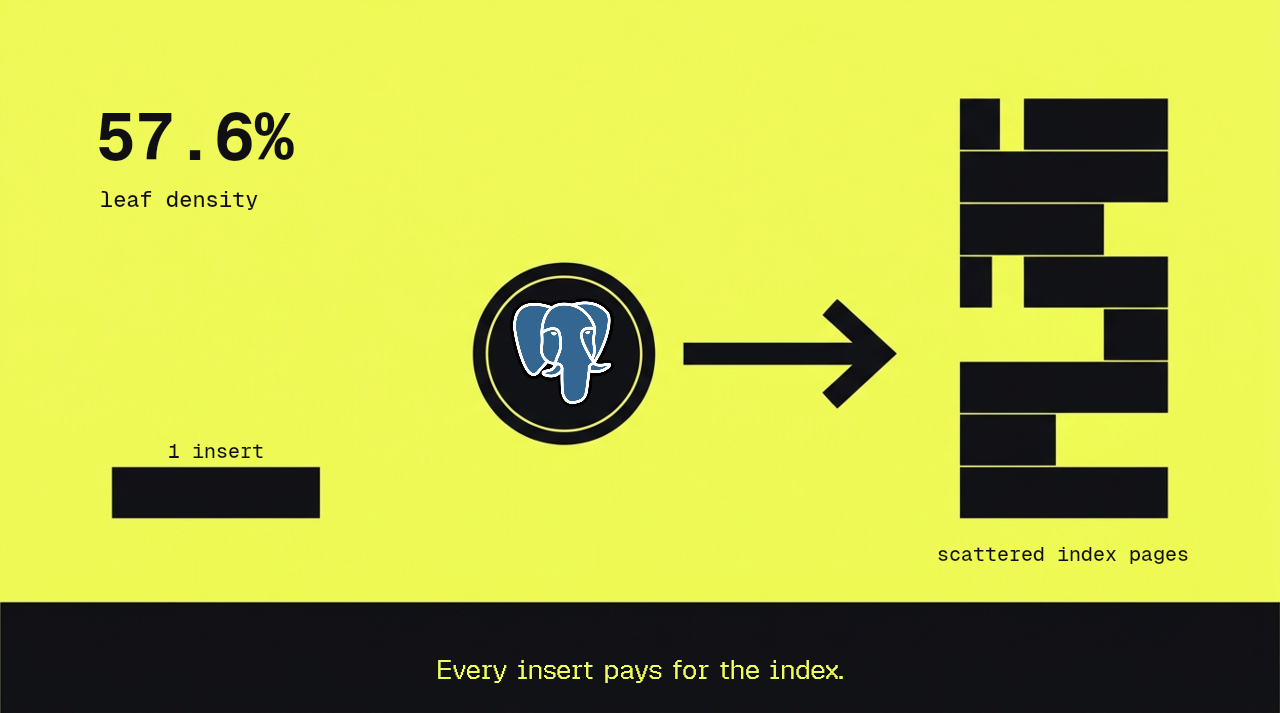
  • pgstattuple's avg_leaf_density (target > 70%) and leaf_fragmentation (target < 30%) are key bloat metrics.
  • A high buffer cache hit ratio can be misleading if indexes are bloated, as wasted pages are still "hits".
  • The provided SQL audit script helps scan all indexes for bloat and analyze cache usage at scale.

Database administrators and backend engineers can use these specific diagnostic tools to proactively identify and resolve hidden PostgreSQL performance issues caused by index bloat, which often escapes standard monitoring.

7/10

Related reading

  1. Knowing When Your Composite Index Earns Its Write Cost

    This guide explains how to evaluate the trade-off of adding a composite index in PostgreSQL by quantifying its read benefits and write costs. It provides a method to measure the impact on ingest throughput and decide if the index earns its overhead based on your system's peak ingest ceiling.

    Timescaletigerdata.com8 min
  2. Introducing TIN: full-text search for Postgres

    PlanetScale’s TIN is a new PostgreSQL extension that implements a full‑text search index supporting Boolean, phrase, span, fuzzy, wildcard, regex, case/accent folding, COUNT(*) and BM25 top‑k queries. In a suite of benchmarks on an i7i.8xlarge EC2 instance (8 vCPU, 32 GB RAM), TIN built in 8 min 10 s (50.7 GB index) and outperformed ParadeDB, pg_textsearch and the built‑in GIN index by large marg…

    PlanetScaleplanetscale.com15 minHN20175
  3. pgAssistant 3.8.0 : continuous improvement loop for Postgres

    pgAssistant 3.8.0 expands from a tuning advisor to a continuous PostgreSQL improvement platform, adding a Collector that records historical workload and environment data. It lets teams run an Observe‑Diagnose‑Prioritize‑Plan‑Implement‑Measure loop, compare consecutive snapshots, and measure the impact of applied recommendations.

    PostgreSQLpostgresql.org1 minrelease
  4. Postgres week in the Netherlands: PGDay Lowlands & Percona Live 2026

    The author recaps two Dutch conferences where they presented ClickHouse‑Postgres extensions and discussed PostgreSQL 19 monitoring enhancements. The post explains how pg_clickhouse provides transparent query push‑down to ClickHouse and how pg_stat_ch streams per‑query metrics, plus new logging defaults and system views in PG 19.

    ClickHouseclickhouse.com7 min
  5. Faster Maps: Chasing Swiss Speed

    ParparVM’s HashMap suffered catastrophic miss latency due to linear probing on dense integer keys. By adopting CPython‑style perturbed probing (Swiss‑table style) and extending tagged immediate values to more primitives, miss latency dropped from 32 s to ~45 ms, allocation pressure fell dramatically, and overall performance stayed roughly flat despite a modest hit‑time slowdown.

    CodeName Onecodenameone.com8 min