proomt

Search

Search posts, papers, and topics

observability

RSS
  1. 31

    pgAssistant 3.8.0 : continuous improvement loop for Postgres

    pgAssistant 3.8.0 expands from a tuning advisor to a continuous PostgreSQL improvement platform, adding a Collector that records historical workload and environment data. It lets teams run an Observe‑Diagnose‑Prioritize‑Plan‑Implement‑Measure loop, compare consecutive snapshots, and measure the impact of applied recommendations.

    PostgreSQLpostgresql.org1 minrelease
  2. 32

    Five models pass the easy code reviews. Then the diffs get hard.

    A hands‑on benchmark of five LLM code‑review models (Claude Opus 5, GPT 5‑6 Sol, Grok 4.6, Kimi 3, GLM 5.3, Qwen 3.8 Max, DeepSeek v4 Pro) shows that all models ace tiny 15‑line diffs but diverge sharply on 100‑300‑line, cross‑file changes. The author built a deterministic harness (single HTTP call, fixed system prompt, JSON output) and measured detection rate, false‑positives, latency, token usa…

    Bjørn Johansenbjornjohansen.com16 min
  3. 33

    For SeaVerse, GKE Agent Sandbox reduces infrastructure costs by 60%

    SeaVerse uses GKE Agent Sandbox (Kata Containers + Cloudhypervisor or gVisor) to run isolated AI sandboxes at scale, achieving 300 allocations / s per cluster (90% ≤ 200 ms) and cutting infrastructure spend by up to 60% via flexible VM sizing and per‑sandbox persistent storage, while gaining native Cloud observability.

    Google Cloud Bloggoogle.com5 min
  4. 34

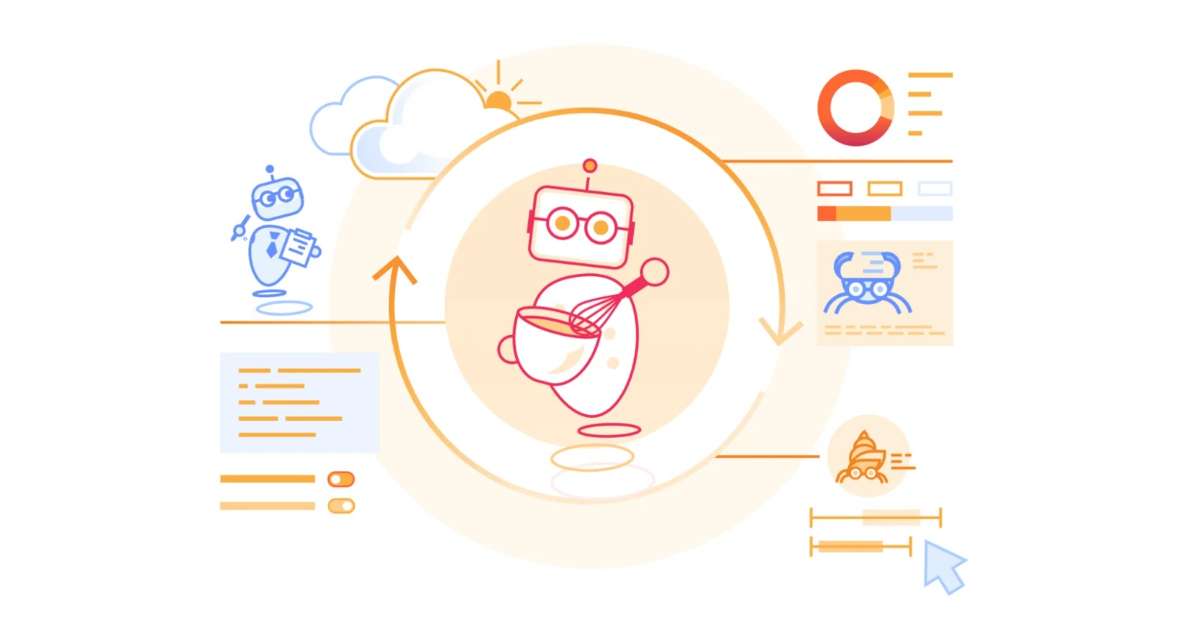
    Cloudflare Introduces the Agent Development Lifecycle to Replace Traditional SDLC

    Cloudflare’s Agent Development Lifecycle (ADLC) replaces the classic SDLC with an autonomous, event‑driven workflow system that lets AI agents handle code generation, testing, deployment, and maintenance. The platform builds on Cloudflare Workflows and the new @cloudflare/ci library to spin up containers, run headless browsers, and chain steps with caching and credential support. Observability is…

    InfoQinfoq.com2 min
  5. 36

    Kubernetes 1.37 Released: Stable Metrics API and Rootless Kubelet in Beta

    Kubernetes 1.37 (Garhwal) ships GA Metrics API, beta rootless kubelet, GA resilient watchcache, GA pod certificates, and a suite of alpha/beta features (workload‑aware scheduling, pod checkpoint/restore, StatefulSet Recreate strategy). The release focuses on stability, security, and AI/ML cost‑optimisation.

    InfoQinfoq.com2 minrelease
  6. 37

    Presentation: When Incidents Refuse to End

    This presentation explains how marathon incidents expose the gap between work as imagined and work as done, revealing system interdependencies, organizational fragility, and human limits. Effective response requires structured endurance, humane rotations, and holistic cross-functional coordination, offering significant technical and organizational learning.

    InfoQinfoq.com32 mintalk
  7. 40

    RADAR: Catch gray failures with anomaly detection

    Databricks built RADAR, a four‑stage, metric‑agnostic pipeline that uses streaming anomaly detection (SPOT) to surface gray failures in minutes with >90% precision. The blog shows how to recreate the system on Databricks for any metric, from billing to model drift.

    Databricksdatabricks.com7 min
  8. 41

    Elastic announces GA of cross-project search on Serverless, enabling teams to query across all linked projects without moving a byte

    Elastic Cloud Serverless now offers General Availability of Cross‑Project Search (CPS), letting you run a single query across up to 100 linked projects (any region, cloud, or solution type) without moving data. Setup is UI‑driven, permissions are evaluated per‑project, and costs are $0.009 / GB retained plus $0.05 / GB egress. CPS works for Observability, Security, Search, vector DB, and ML jobs,…

    Elasticelastic.co6 minrelease
  9. 42

    Server Monitoring in the age of AI: What static thresholds miss and how adaptive monitoring fixes it?

    Static CPU/memory thresholds generate noise because workloads vary by time‑of‑day, day‑of‑week, and long‑term trends. Adaptive monitoring learns per‑server baselines (using simple ML on historic metrics) and creates dynamic thresholds plus anomaly alerts. ManageEngine OpManager’s Zia engine is presented as a turnkey AIOps solution that auto‑learns baselines, lets you set sensitivity, and adds ale…

    SitePointsitepoint.com6 min
  10. 43

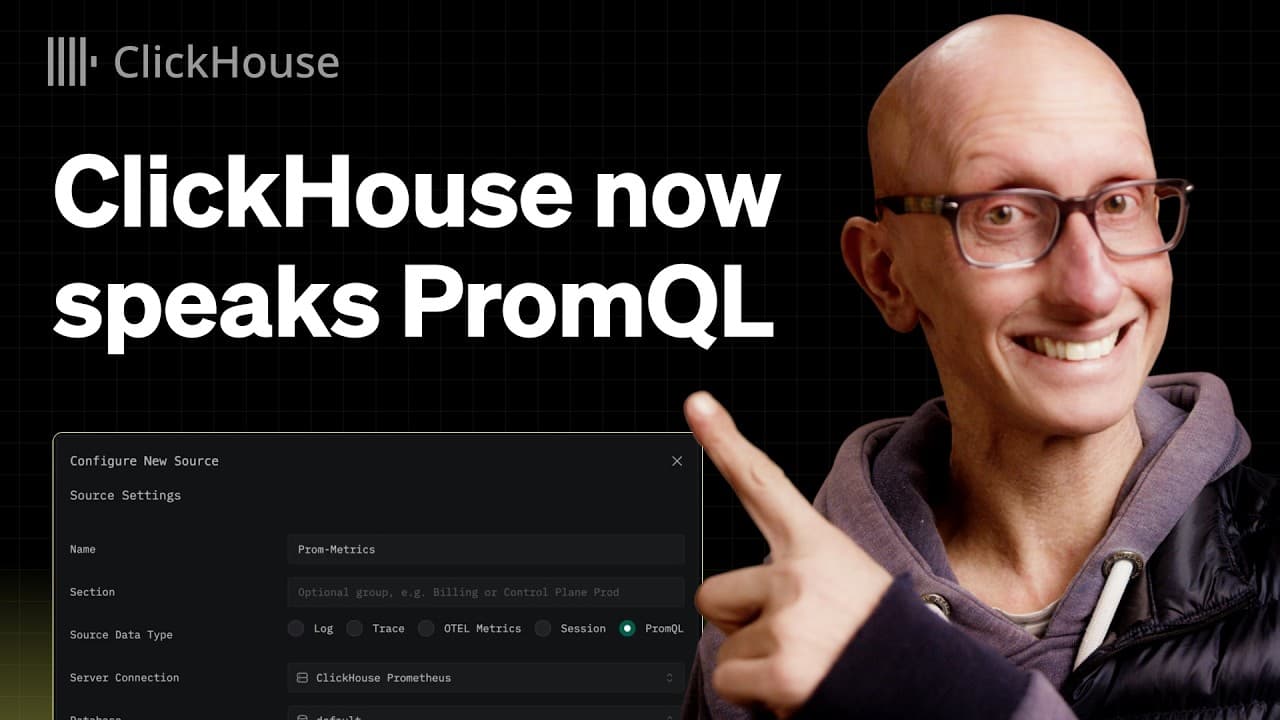
    September 2026 newsletter

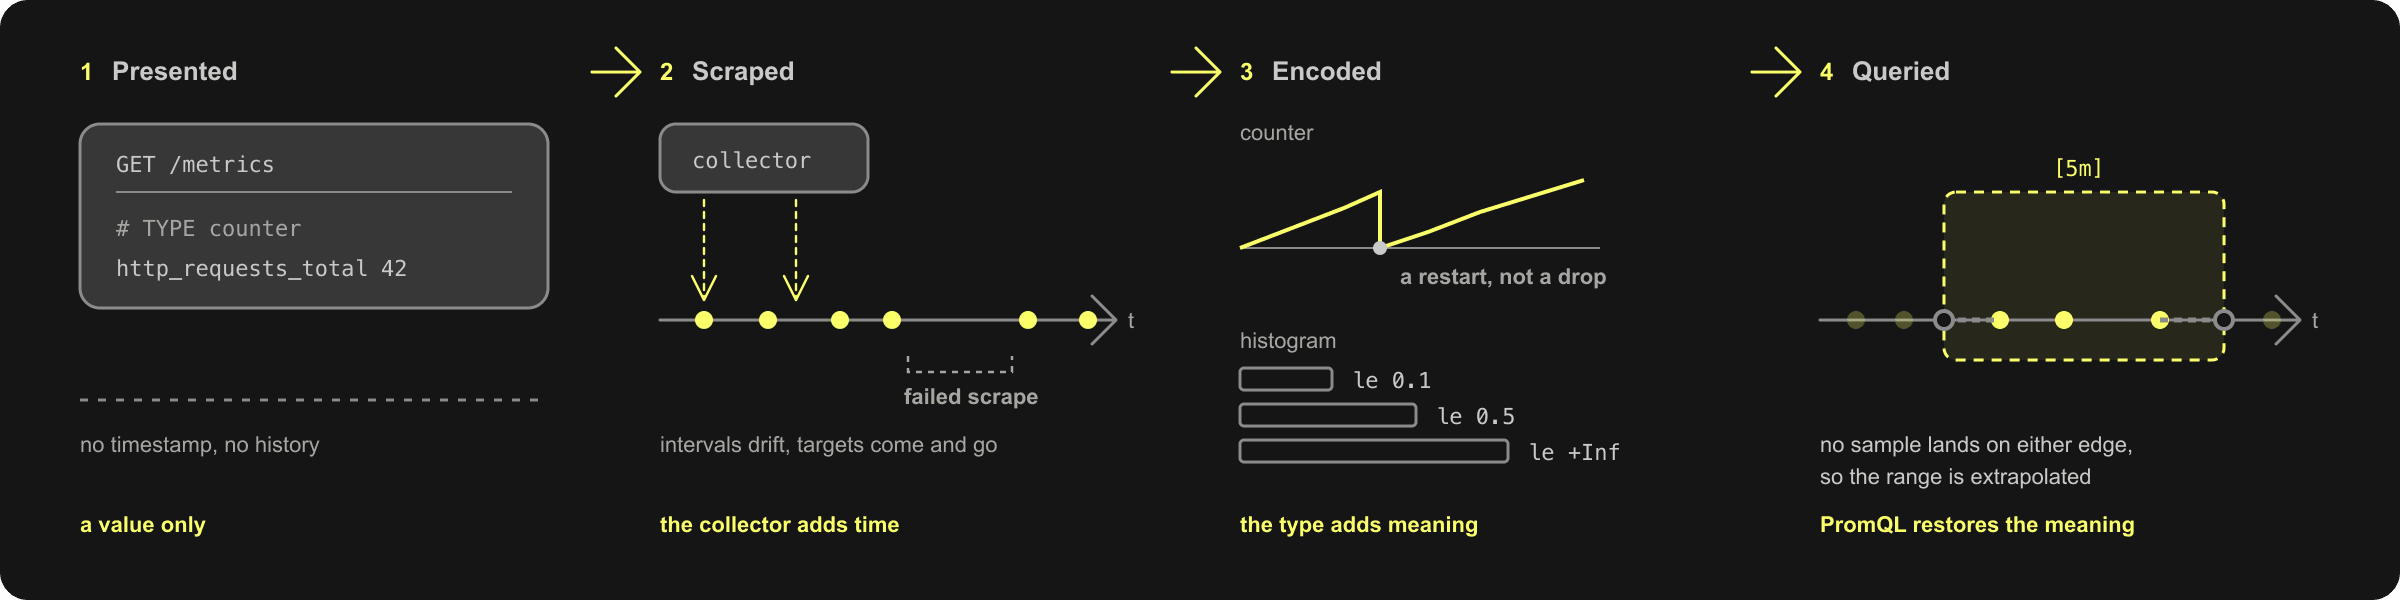
    ClickHouse's September 2026 newsletter highlights the 26.8 release with features like pipelined SQL and custom HTTP handlers, alongside previews for On-Demand Compute and a PromQL-compatible TimeSeries engine. It also covers new Postgres integration tools and a cost-performance benchmark for cloud data warehouses.

    ClickHouseclickhouse.com7 min
  11. 44

    Java News Roundup: JDK 27, Open J Proxy, A2A Jakarta, Azul Payara, BoxLang, Netflix ja

    InfoQ’s Java roundup lists the GA release of JDK 27, early‑access build 16 of JDK 28, BellSoft’s Liberica JDK 27, Jakarta EE 12 updates, Open J Proxy 1.0 (with JDBC cache and HikariCP leak detection), A2A Jakarta 1.0, Azul Payara 7.4.0 (MicroProfile 7.1, OpenTelemetry migration), JHipster 9.4 (Playwright, esbuild), Ktor 3.6 (OIDC auto‑discovery), BoxLang 1.17 (module service, syntax checker) and…

    InfoQinfoq.com5 min
  12. 45

    CISA's Logging Reference Architecture for OMB M-26-14: What federal agencies should do next

    CISA’s Logging Reference Architecture translates OMB M‑26‑14 requirements into eight concrete shifts, from searchable storage tiers to schema‑first design and continuous validation. Agencies should use Elastic’s tools to build a heterogeneous, schema‑first logging architecture and file a plan by 18 Nov 2026 to meet the mandated maturity milestones.

    Elasticelastic.co11 min
  13. 47

    Microservices vs Monolithic Architecture: What Nobody Tells You Until You've Lived Through Both

    The article walks through the hidden costs of both monoliths and microservices, showing that the choice isn’t about hype but about concrete trade‑offs like deployment coordination, observability, data consistency, and team structure. It recommends a modular monolith as a pragmatic middle ground when the organization isn’t ready for full service sprawl.

    SitePointsitepoint.com9 min
  14. 48

    E-Signature Pricing Models That Bite in Production

    The post shows that e‑signature pricing is an engineering constraint and walks through modeling effective cost per completed envelope, preventing duplicate billing with idempotency, and monitoring usage. It includes a JavaScript cost estimator and practical retry handling advice.

    SitePointsitepoint.com6 min
  15. 49

    What's new in ClickStack - Aug ’26

    ClickStack August 2026 update adds general‑availability dashboard variables (including cross‑source SQL, Lucene, PromQL macros), chart formulas for derived metrics, a metrics explorer UI, release‑marker overlays, OIDC auth for the collector, and a beta LLM observability dashboard. It also introduces a private‑preview TimeSeries engine with PromQL support, letting ClickStack store and query Promet…

    ClickHouseclickhouse.com16 min
  16. 50

    How to operate shared platforms safely at agent scale

    Datadog explains how scaling AI agents turns isolated executions into shared‑platform risk and outlines a systematic approach to model agent trajectories, monitor per‑dependency constraints, and enforce workload‑specific capacity policies. The result is proactive detection of bottlenecks and protection against noisy‑neighbor failures.

    Datadogdatadoghq.com11 min
  17. 51

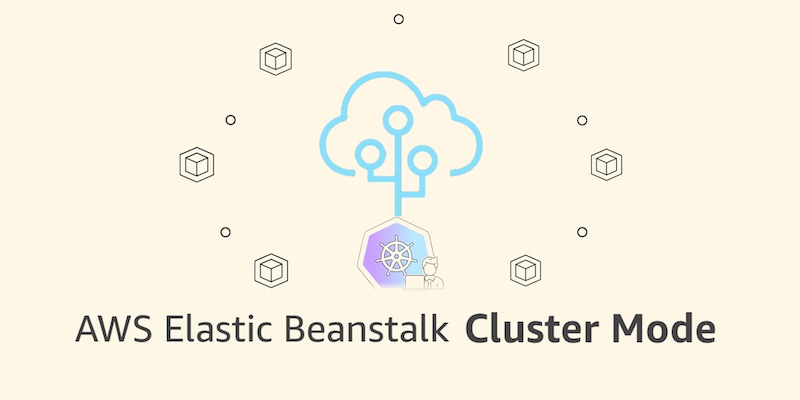
    AWS Elastic Beanstalk introduces Cluster Mode

    AWS Elastic Beanstalk now offers a fully‑managed Cluster Mode that runs multiple applications on a shared Amazon EKS cluster, handling containerization, scaling, patching and observability automatically. It adds AI‑driven troubleshooting, OpenTelemetry support and standard deployment strategies while charging only for the underlying AWS resources.

    AWSamazon.com5 minrelease
  18. 52

    Brownfield Agentic Engineering

    Addy Osmani outlines a pragmatic framework for safely introducing AI‑driven agents into legacy (brownfield) codebases. He proposes zoning code by risk, documenting non‑code knowledge, preserving research in durable memos, building a reusable “harness” of tools and rules, and starting with zero‑risk, characterization‑test‑driven work.

    Addy Osmaniaddyosmani.com13 min
  19. 54

    Next.js 16.3 support on Vercel

    Vercel added full support for Next.js 16.3, bringing leaner prefetching, immutable static assets, and faster route metadata handling. Early adopters see up to 45% fewer prefetches, 24% less static traffic, and roughly 2× faster routing at scale.

    Vercelvercel.com4 min
  20. 55

    What is AIOps?

    Databricks’ blog post explains what AIOps is, its core components (data ingestion, normalization, anomaly detection, correlation, RCA, automation, collaboration), and why it’s gaining traction now. It positions AIOps as a layer between observability and action, emphasizing human‑in‑the‑loop for high‑risk steps, and outlines domain‑centric vs. domain‑agnostic approaches and common use‑cases like R…

    Databricksdatabricks.com13 min
  21. 57

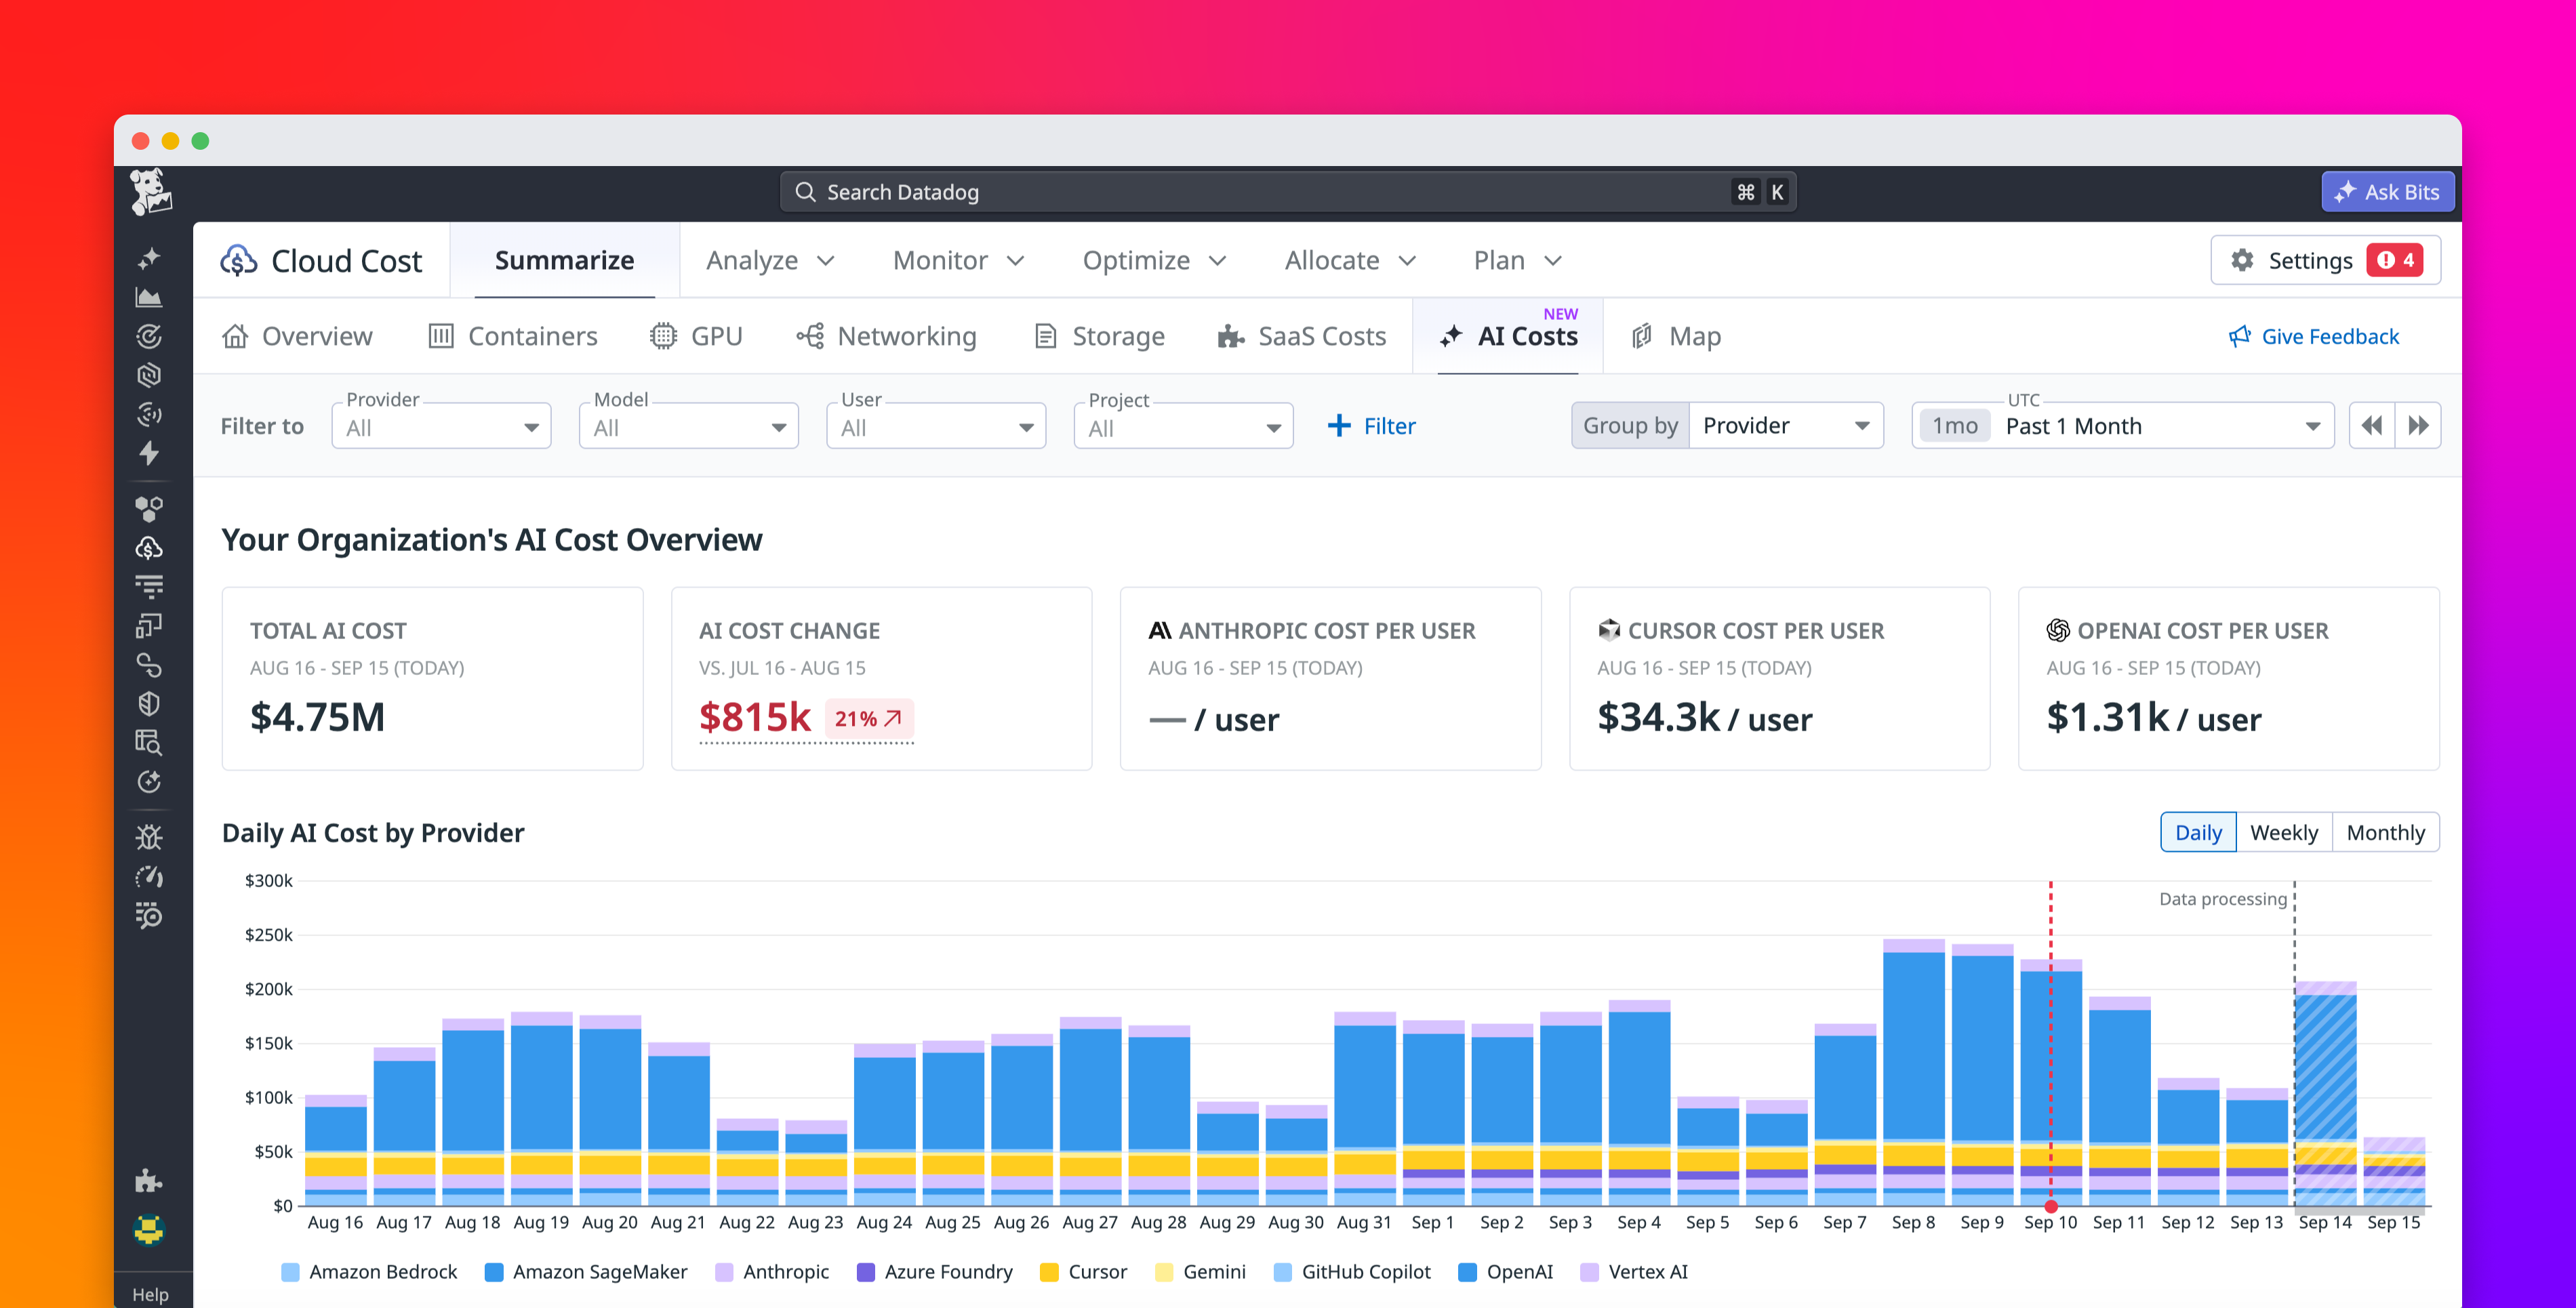
    Manage Cursor costs with Datadog Cloud Cost Management

    Datadog Cloud Cost Management now integrates Cursor AI‑coding usage, exposing per‑user, per‑model, and mode breakdowns, out‑of‑the‑box dashboards, anomaly detection, and budget/monitoring tools so FinOps can track and control AI coding spend alongside other cloud and SaaS costs.

    Datadogdatadoghq.com5 min
  22. 58

    The Flaky Test Confession: “We All Know We’re Ignoring Test Failures”

    Flaky tests silently erode CI reliability, waste compute and developer time, and let real bugs slip into production. The post quantifies the cost (≈2.5 % of developer time, $5.67 per manual investigation vs $0.02 for auto‑rerun) and critiques common band‑aid approaches (retries, quarantine, manual triage). It argues that visibility—detecting flaky tests, predictive test selection, and automated t…

    Codeshipcloudbees.com5 min
  23. 60

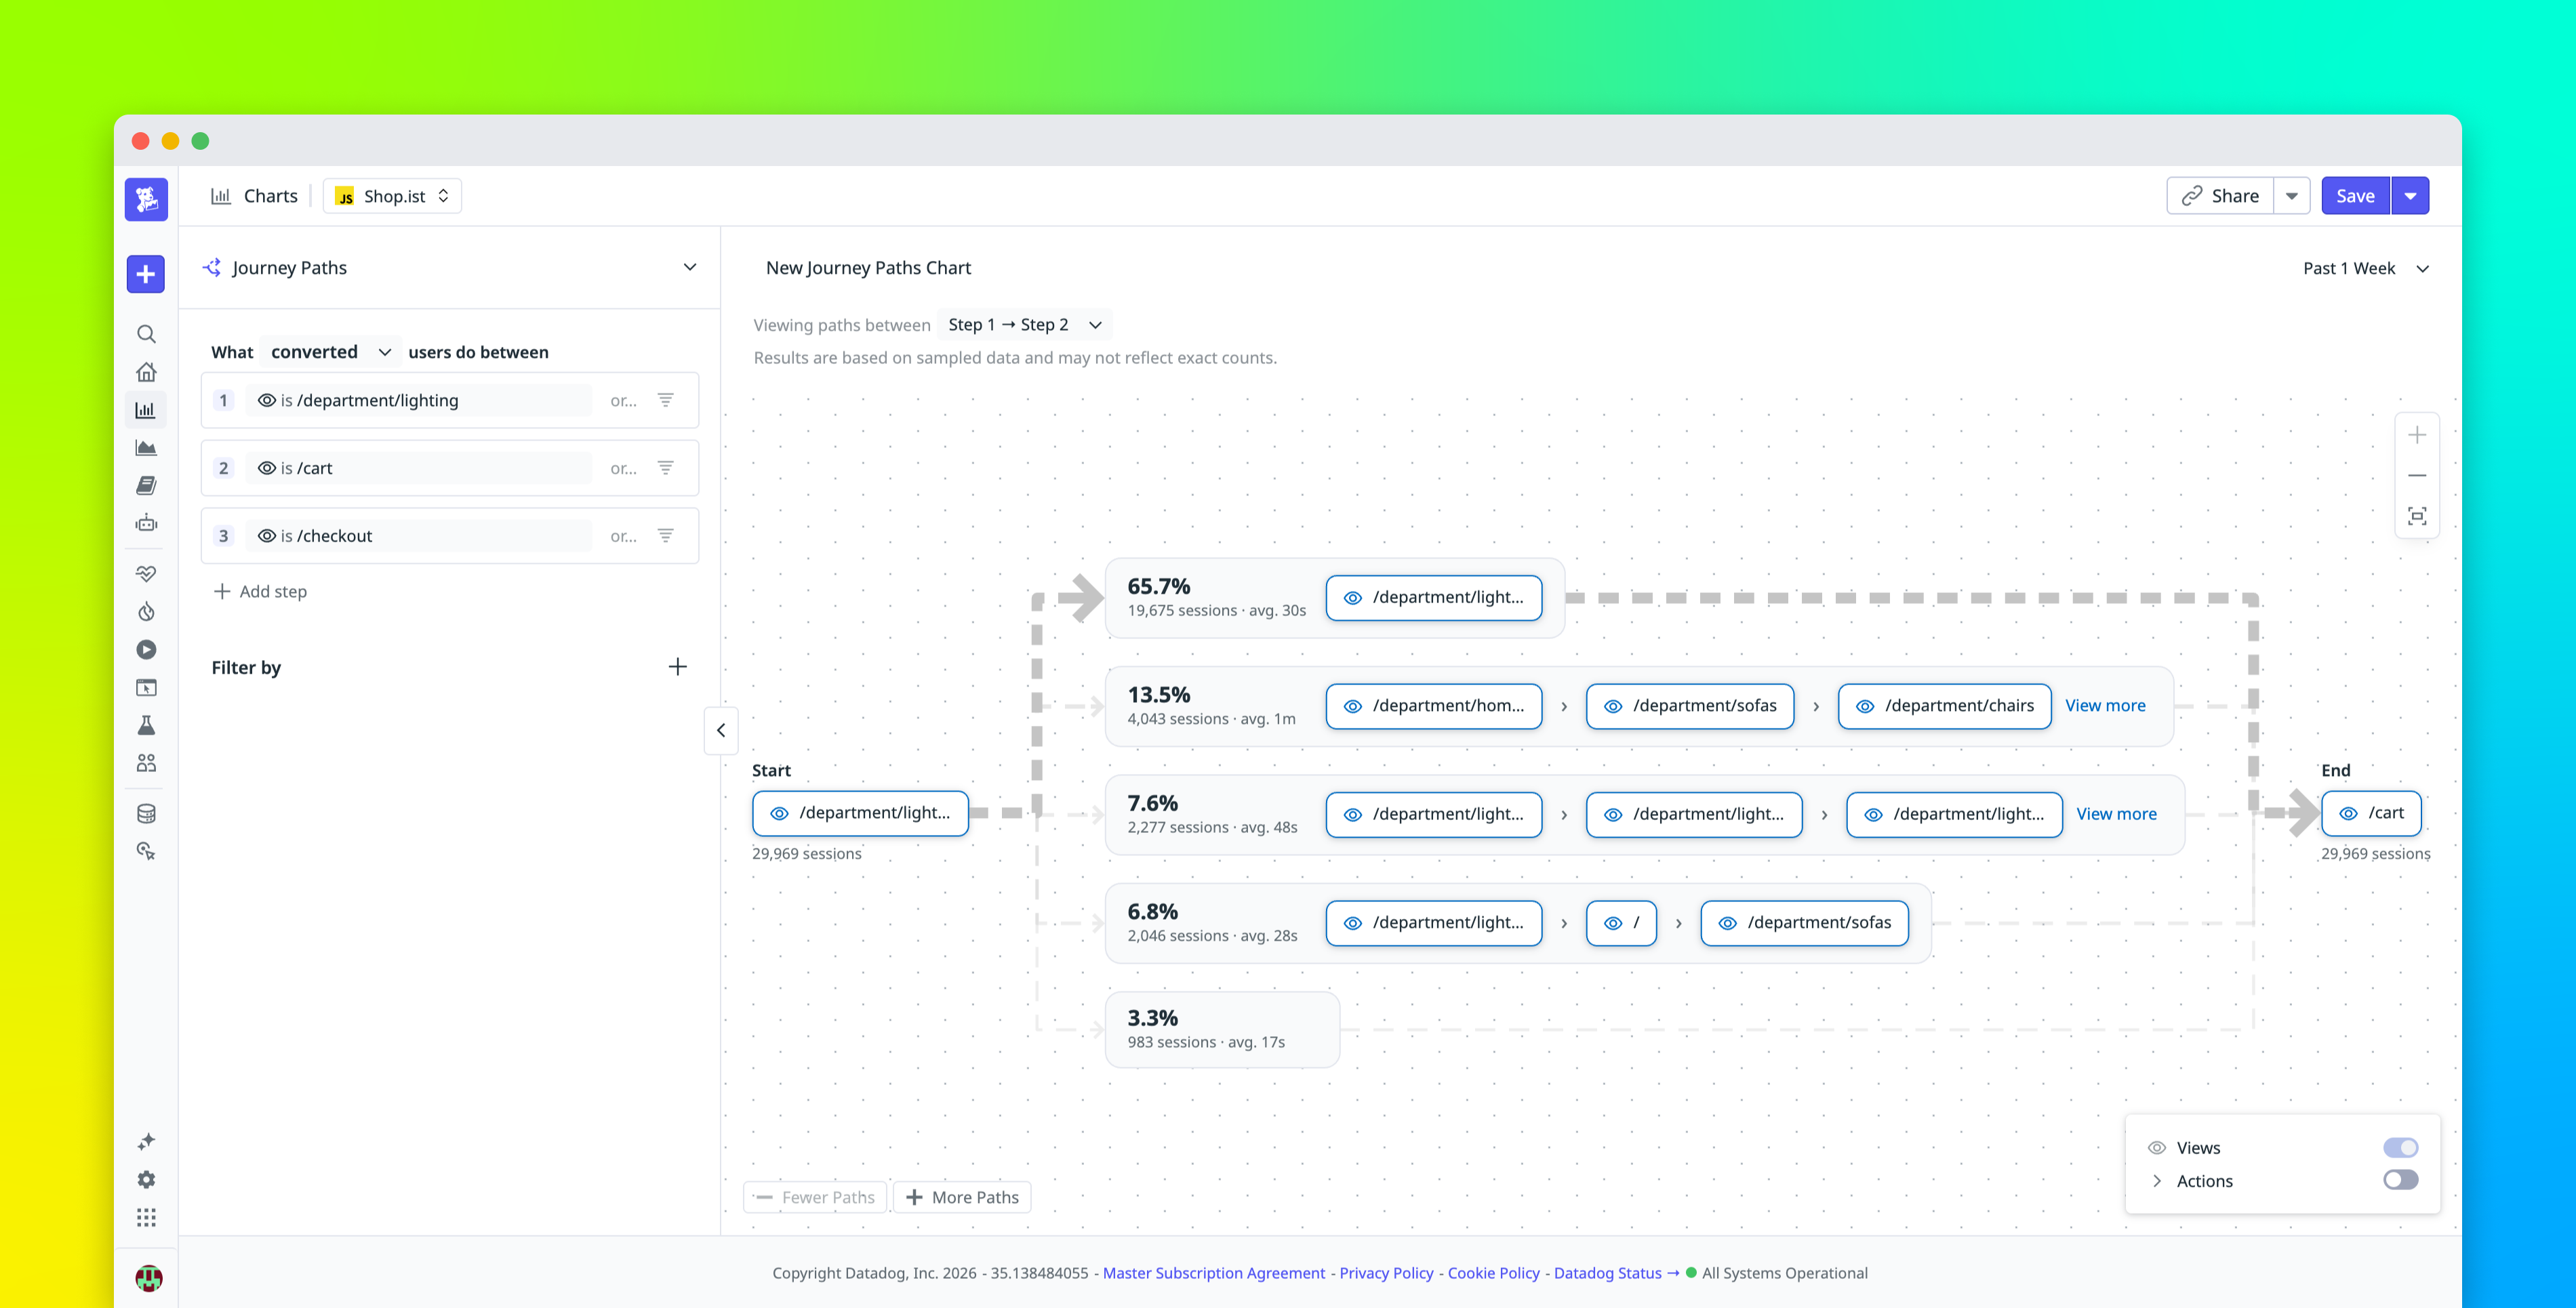
    Understand the top paths users take to convert or drop off with Journey Paths

    Datadog’s Journey Paths visualizes the most common sequences users follow through a defined flow, letting you rank converted vs. dropped‑off paths, spot detours or dead ends, and drill into the underlying user segments with Conversion Analysis, Session Replay, and RUM. It’s a UI‑level feature that augments funnel percentages with concrete path data, but the post offers no implementation details o…

    Datadogdatadoghq.com4 min